Summary
The main drivers behind Cassandra performance are:
- Hardware
- Data Model
- Application specific design and configuration
(quick link to the modeler Cassandra Data Modeler for those that are just looking for the tool)
For many early stage projects that are trying to make hardware and data modeling decisions to maximize performance, it is often beneficial to take the app specific questions out of the equation and design and test a table that will scale on a given hardware configuration. Furthermore, projects may not even have datasets to use for testing. It can be time consuming to generate realistic test and to build temporary benchmarking applications to read and write said data to/from c*.
Jake's post on cassandra-stress 2.1 depicts how stress can enable users to take their app out of the equation, and quickly run benchmarks with their data model on their hardware.
Why would you want to benchmark your own schema on your own hardware?
-
You may want to iterate on a data model decision before building your app. Avoid building an app on the wrong data model and finding out you have to change it all later!
-
This gives you a baseline of how your cluster will perform (in terms of reads / writes per second, latency SLA's, and even node density). This is the first step for a sizing conversation as it gives an architect an idea of what provisioning requirements will look like for their peak workloads.
-
Know that your data model will scale linearly and have an idea (predictability) of at what point you should be planning to scale out.
Cassandra-stess, like many powerful tools, is also complex. It requires some statistical understanding and syntactic skill, in order to get up and running with even a simple data model user profile driven test (for details see the cassandra-stress docs). Furthermore, designing a good cassandra data model requires basic understanding of how CQL works and how c* data is laid out on disk as a result of partitioning and clustering.
The purpose of this post is to describe how the Cassandra Data Modeler aims to simplify this task, getting users up and running with user profile powered cassandra-stress tests in minutes.
The main goals are as follows:
- Help users design data models by helping them understand the main tradeoffs that data modeling presents them with and providing a dynamic storage engine visualization that shows how data is laid out on disk for a particular CREATE TABLE statement.
- Guide users on how to reason about and select appropriate
Size,Population, andClusterdistributions that match the nature of their data quickly. - Remove syntactic barriers by providing a web form that will generate a
stress.yamland the cassandra-stress command that should be used to run a simple test quickly and easily.
Note: There are many reasons why your app may not perform exactly like cassandra-stress, you must take this excersize for what it is--a baseline that gives you an idea of what kind of performance to strive for and how your cassandra cluster can scale.
Data Model Tradeoffs, Visualizing the Storage Engine
The art of data modeling is a mix between:
- building tables that are convenient for development based on your access patterns and
- designing tables that will scale and meet performance SLA's
The main reason a table may not scale well is if it allows for unbounded partitions. The following heuristic is not exact but it does simplify this exercise significantly and is quite battle tested in the field. When designing your c* table you should aim to ensure that the size of your partitions are smaller than 100 mbs and 100,000 cells. I have seen multi GB partitions and million cell partitions. I assure you they are painful to work with and you want to avoid them from the get go.
The main way to ensure this is by controling your partition key which is the first element in your cql primary key. The CassandraDataModeler renders a visual representation of your table on disk for ease of understanding.
For example you may want to take this data model:

and add a compound partition key:
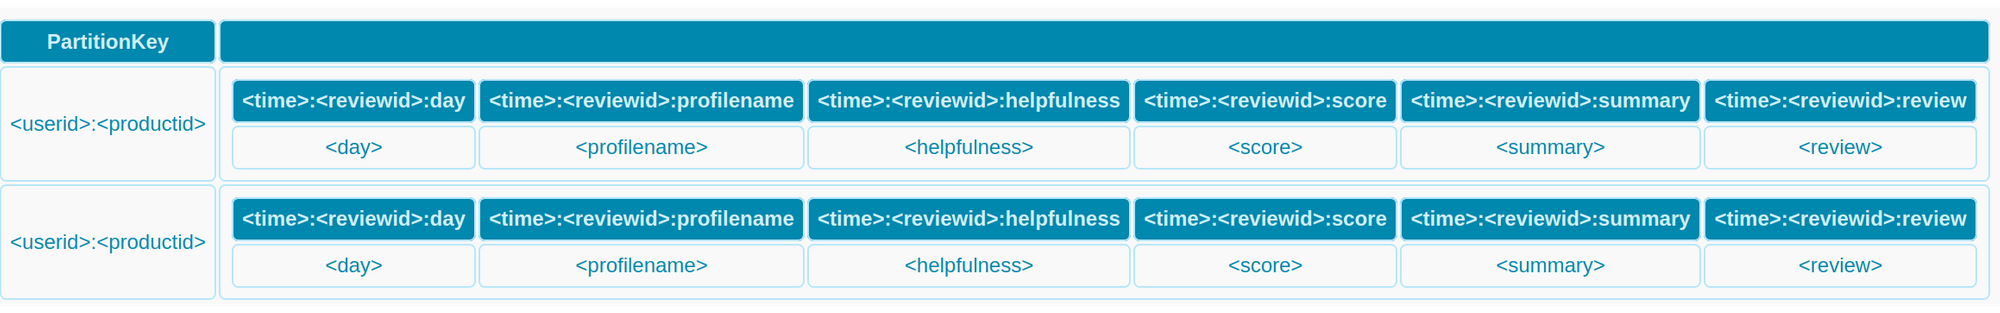
This would help you limit the amount of data, per partition making your data model more scalable. When doing this exercise you also want to esure you're preventing hotspots. For example, does most of your traffic come from one userid productid combination? If so, only one set of replica nodes are going to be doing most of the work if you use the data model above!
The tradeoff is that with the new data model it may be a bit harder to get at your data.
I.E. previously you could run these queries:
Likely select queries for this data model:

SELECT * FROM reviews_by_day WHERE userid = ?;

SELECT * FROM reviews_by_day WHERE userid = ? AND productid = ?;

SELECT * FROM reviews_by_day WHERE userid = ? AND productid = ? AND time = ?;

SELECT * FROM reviews_by_day WHERE userid = ? AND productid = ? AND time = ? AND reviewid = ?;
With the new data model you must know both the userid and the productid to get at your data, which implies some more work on your app side if you need cross product data:
Likely select queries for this data model:

SELECT * FROM reviews_by_day WHERE userid = ? AND productid = ?;

SELECT * FROM reviews_by_day WHERE userid = ? AND productid = ? AND time = ?;

SELECT * FROM reviews_by_day WHERE userid = ? AND productid = ? AND time = ? AND reviewid = ?;
For use cases with a lot of data, I recommend designing a data model that scales in a healthy fashion and then work on any additional tables (yes, data duplication) you may need to match your access patterns.
Grokking Stress Field Distributions
There are three distributions in cassandra-stress. Size, population, and cluster distributions.
Good ballpark setting for each of your fields will give you a realistic stress profile.
Size Distribution
The size distribution answers the question: how big are my data values? When you select a cql type that maps to a Java primitive, the size on disk for each of those values is always the same. The Data Modeler will pre-populate those fields with their values (i.e. ints are 32 bits = 4 bytes). Make sure you select fixed as the distribution type since an int will always take up the same amount of space.
For variable types like text, try to think about the distribution of the field's sizes. For example, if I have a field album_name in a music database, I might think about what the shortest and longest albums in my database are. According to google, somebody called Alice in Chains has an album called 13 so let's make 2 the minimum value in our distribution. Apparently there are some pretty long album names out there so maybe this distribution has long tails. To keep it simple let's say the upper bound is 105 bytes.
If we assume that album names will most likely be around 50 bytes long and the distribution looks like a bell curve then we might guess that the size distribution for album_name is normal (or gaussian) and goes from 5 to 105.
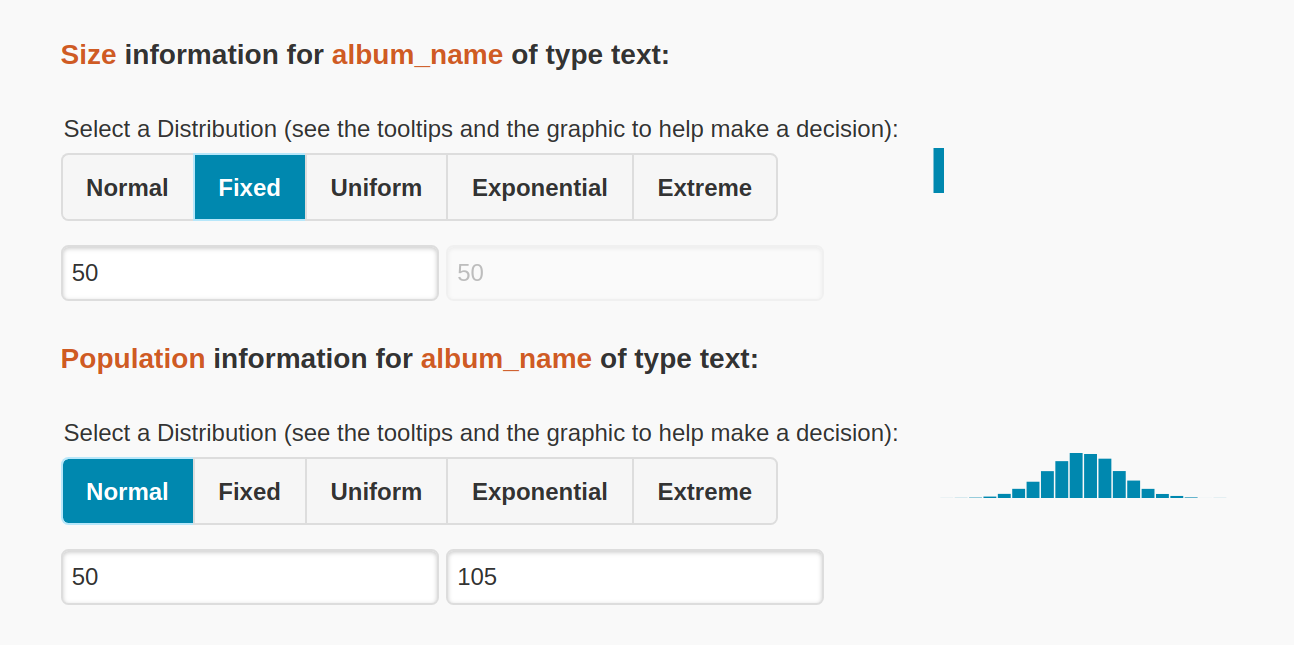
Hover over the distribution types types to get descriptions of the distributions. Click on a type and the histogram on the right will give you a visual representation of the distribution type's shape.
Population Distribution
You want to think about the population distribution in terms of cardinality and frequency.
Cardinality: You may have many unique album names in your database (a google search result tells me that Spotify has 30 million songs so let's say there will be ~4 million albums in our db), this means that the range of the distribution (regardless of which distribution type you pick) should be wide, let's say (1..4000000).
Frequency: Do you expect each album to appear in your dataset the same amount of times? If a field has a flat frequency profile -- same for every one-- it's distribution is Uniform, if it has a bell shaped profile, some values will appear more frequently than others based on a number of random variates, then it is Normal / Gaussian. Again, use the histogram images and the tooltip descriptions in the application for guidance when picking the distribution type based on the frequency of your field.
If our dataset stores album sales or plays, the population distribution of the albums might be normal since some artists might be played more than others resulting in a bell curve distribution, or more likely given the dominance of a few genres and artists (top 40) it might be exponential.
You know your business data better than I do! But this is the kind of thinking you want to apply when selecting your population distributions.
Cluster Distribution
The final distribution only applies to clustering columns. It is similar to the population distribution except that instead of thinking about the entire dataset, you want to think about occurrences of your clustering column within the partition key. This essentially gives you the ability to generate wide rows.
For a table with the following PK:
CREATE TABLE album_plays_by_user(
...
...
PRIMARY KEY (user_id, album_name)
);
What is the cardinality and frequency of album_names for a given user_id?
I expect the average user to listen to somewhere between 100 and 1000 different albums on Spotify so we may have between 100 and 1000 album_names in a given partition key.
Given this logic, the cluster distribution for album_names might be gaussian (100..1000).
Running Stress on the first try
Once you have finished filling out the second tab in the Cassandra Data Modeler, go to the third tab and click the download button. This generates a file that you can use to run cassandra-stress with.
Your command to insert 100k records would look like this:
cassandra-stress user profile=autoGen.yaml n=100000 ops\(insert=1\)
Optimizing Stress
Once you have cassandra-stress running here are a few considerations to look out for to ensure you have a good benchmark.
- If you run stress on one of your cassandra nodes, it will contend against the same OS subsystems as your c* instance. You may want to move your stress workload to it's own machine(s).
- If your cassandra cluster seems under utilized and your ops rates are not increasing as you add nodes, the chances are you are not generating enough traffic from the client (
cassandra-stress). Is your cassandra stress box under utilized? If not, consider increasing the amount of threads for stress with therate threads=8lever. - If your stress box is fully utilized and you are still not saturating your cassandra cluster, you may need to beef up the machine running stress (bigger box) or scale out by setting up multiple machines to run stress against the cluster.
Tools like htop and dstat are invaluable when performing this exercise.
Specifically I like to run dstat -rvn 10 and htop in multiple screen sessions accross all nodes. Doing this constantly during benchmarks and regular workloads will help you get an idea of what is and isn't normal and help you identify and remove bottlenecks.
For a deeper dive into Cassandra tuning, check out Al Tobey's tuning guide.