Metrics and visibility are critical when dealing with distributed systems.
In the case of DSE Analytics we are interested in monitoring the state of the various Spark processes (master, worker, driver, executor) in the cluster, the status of the work the cluster is doing (applications, jobs, stages, and tasks), and finally we are also interested in the detailed metrics provided by the spark cassandra connector. This article focuses on the first two and we leave the integration of the spark cassandra connector monitoring for a second post.
With the DataStax Enterprise (DSE) Metrics Collector (new as of DSE 6.7 and backported to 6.0.5) DataStax makes exporting metrics to your monitoring solution of choice simple and easy. Donnie Robertson wrote an excellent DataStax Academy blog on how to run DSE with the insights collector providing metrics for Prometheus and Grafana in a completely dockerized setup.
At its core, the DSE Metrics Collector is as a managed collectd sidecar bundled with the DSE binaries. DSE server manages the lifecycle of the collectd process and allows users to manage collectd configuration via `dsetool.` Customers can ship the DSE metrics events (generated by the database) to the endpoint of their choice*.
To monitor DSE Analytics (spark jobs) we can leverage a collectd plugin* to monitor DSE Analytics / Spark.
Just show me the code!
This bash script stands up Prometheus & Grafana and hooks up spark metrics assuming DSE is installed and running on localhost via a package install. I'll break down the steps in the rest of the article.
collectd-spark
The lovely folks at Signalfx wrote a spark plugin for collectd that gathers metrics via HTTP from the spark master and worker. To use it, simply clone the plugin and move it to the dse collectd directory (in the case of a package install /usr/share/dse/collectd) as follows:
git clone https://github.com/signalfx/collectd-spark

mkdir /usr/share/dse/collectd/collectd-spark
cp collectd-spark/spark_plugin.py /usr/share/dse/collectd/collectd-spark/
Since collectd-spark is written in python, we need to inform the bundled collectd where to find the python binaries with the following symlink:
# add config for collectd collectd spark plugin
ln -s /usr/lib/python2.7/ /usr/share/dse/collectd/usr/lib/python2.7
We enable and configure both the collectd-spark plugin as well as the write Prometheus plugin by adding a config file in the DSE collectd directory. Notice that I dynamically pulled the spark master URL by hitting the Spark rest API running on localhost.
MASTER_URL=$(curl localhost:7080 -LIs | grep Location | awk -F' ' '{print $2}' | awk -F':' '{print $1 ":" $2}')

mkdir /etc/dse/collectd/
cat << EOF > /etc/dse/collectd/10-spark.conf
LoadPlugin python
<Plugin python>
  ModulePath "/tmp/spark-insights/collectd-spark"

  Import spark_plugin

  <Module spark_plugin>
  MetricsURL "$MASTER_URL"
  MasterPort 7080
  WorkerPorts 7081
  Applications "True"
  Master "$MASTER_URL:7080"
  Cluster "Standalone"
  </Module>
</Plugin>

LoadPlugin write_prometheus
<Plugin write_prometheus>
 Port “9103”
</Plugin>
EOF
Insights Collector
We are now ready to bring up collectd. If Metrics Collector is enabled and running, disable and enable it again or kill the collectd process. Killing the collectd process will trigger DSE to bring it back up with the new config.
# turn on collectd
# if insights has already been enabled, either DISABLE and then enable again or kill the collectd process. DSE will bring it back up with the new config.
#dsetool insights_config --mode DISABLE
dsetool insights_config --mode ENABLED_WITH_LOCAL_STORAGE
Grafana and Prometheus
Finally, we bring up Grafana and Prometheus using docker compose. If you already have Grafana and Prometheus running elsewhere, you can add the Prometheus targets to point to 9103 on each of your DSE nodes. Notice that we also clone the dse-metric-reporter dashboards from the DataStax repo that comes with pre-built Grafana dashboards for DSE.
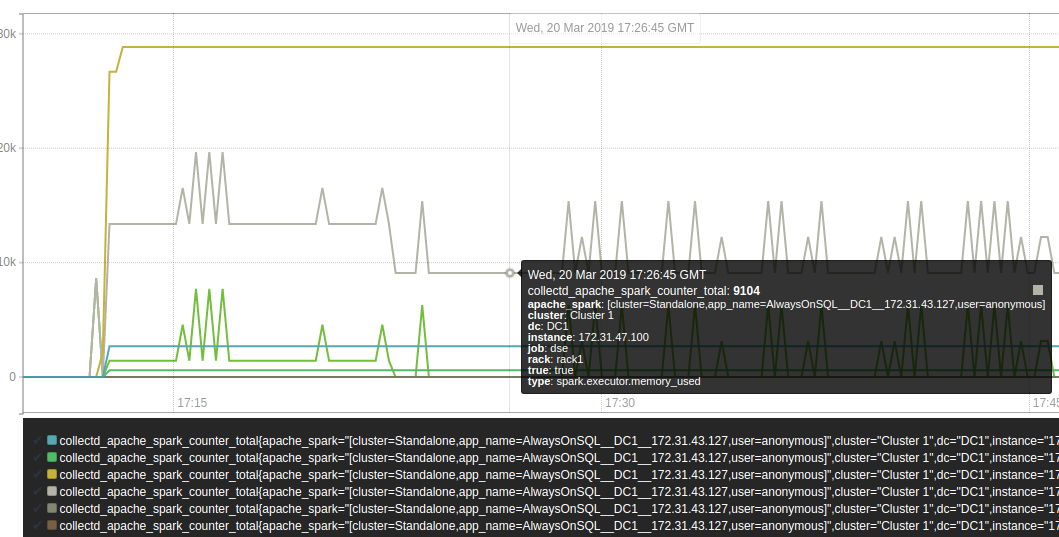
The new Spark metrics will appear under collectd spark in Prometheus and Grafana allowing you to create custom dashboards for them.
export PROMETHEUS_DATA_DIR=/mnt/ephemeral/prometheus
export GRAFANA_DATA_DIR=/mnt/ephemeral/grafana

mkdir $PROMETHEUS_DATA_DIR
mkdir $GRAFANA_DATA_DIR

chmod 777 $PROMETHEUS_DATA_DIR
chmod 777 $GRAFANA_DATA_DIR

git clone https://github.com/datastax/dse-metric-reporter-dashboards.git
cd dse-metric-reporter-dashboards

cat /etc/hosts | grep node | grep -v ext| grep -v allnodes | awk -F' ' '{print $1 ":9103"}'  | jq -R . | jq -s ".| [{targets:[.[]], labels:{cluster: \"test_cluster\" }}]" > prometheus/tg_dse.json

pip install docker-compose

docker-compose up &
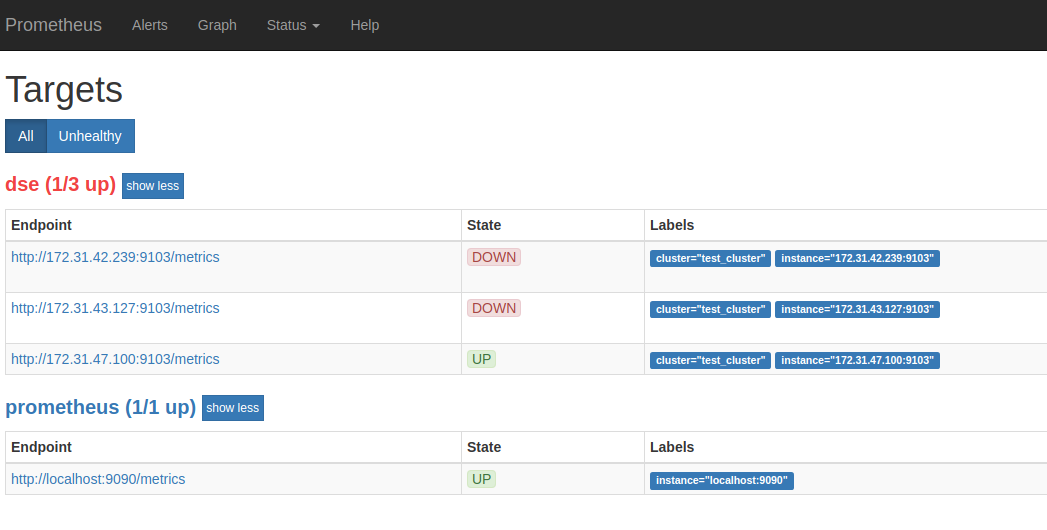
The screenshot below shows Prometheus picking up data from three targets, only the first of which has been configured with the DSE Metrics Collector.
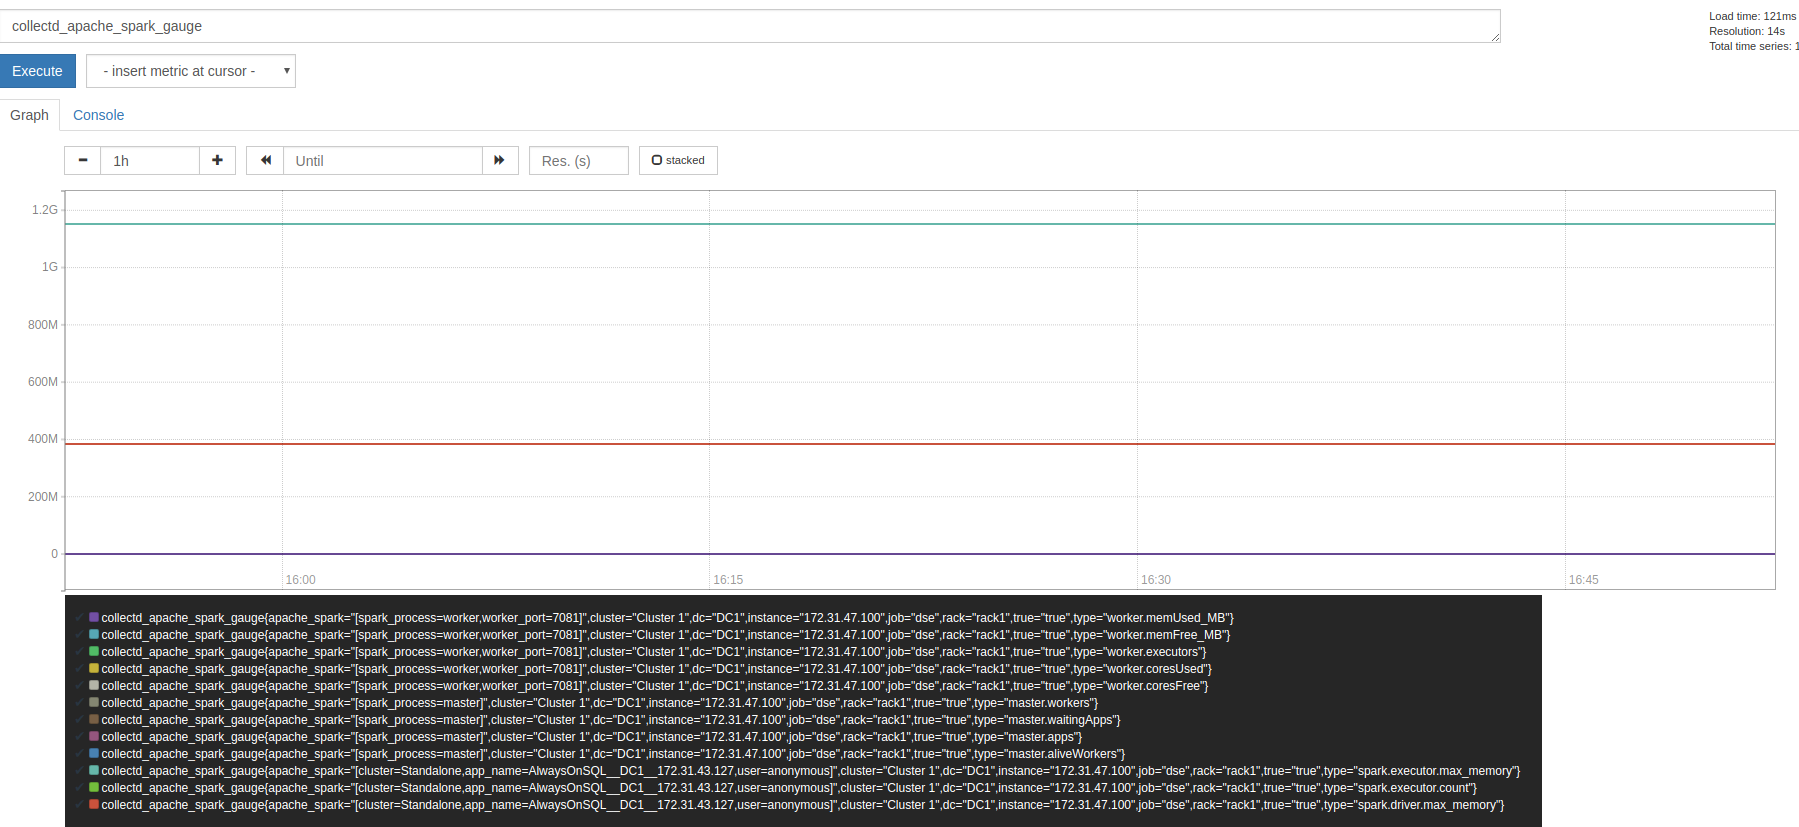
The spark data can be visualized in the graph screen in Prometheus for Prometheus query troubleshooting:
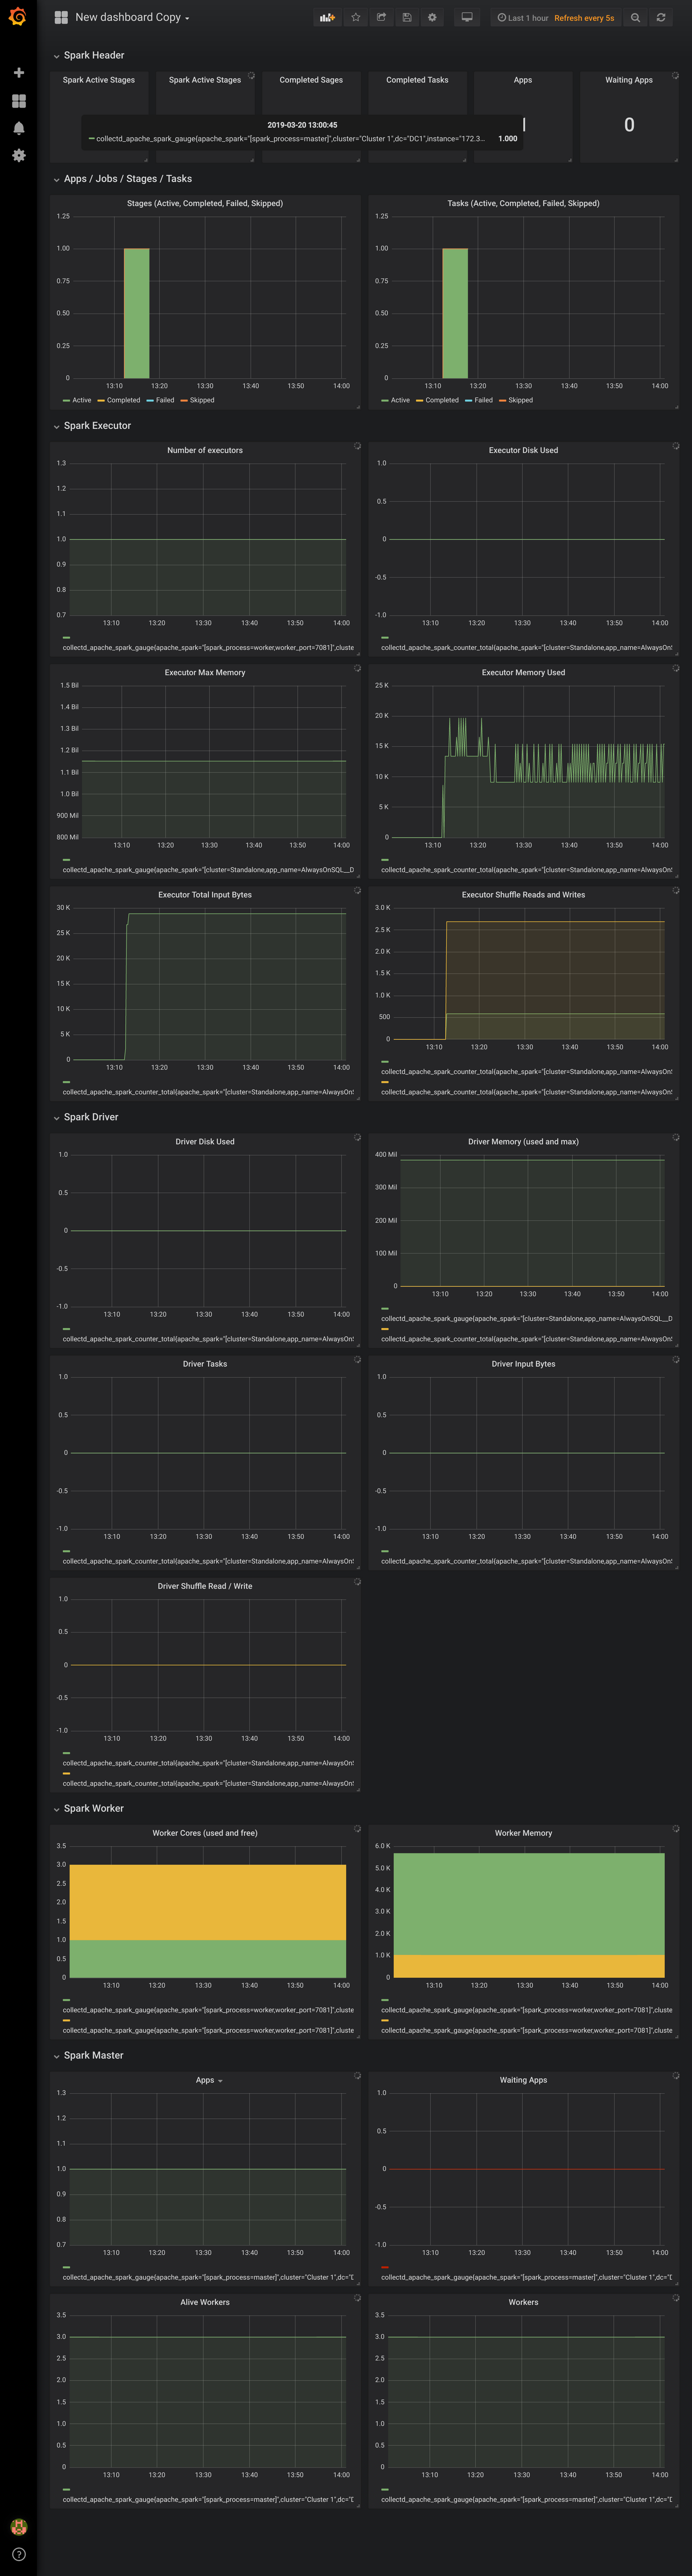
And in Grafana as well:
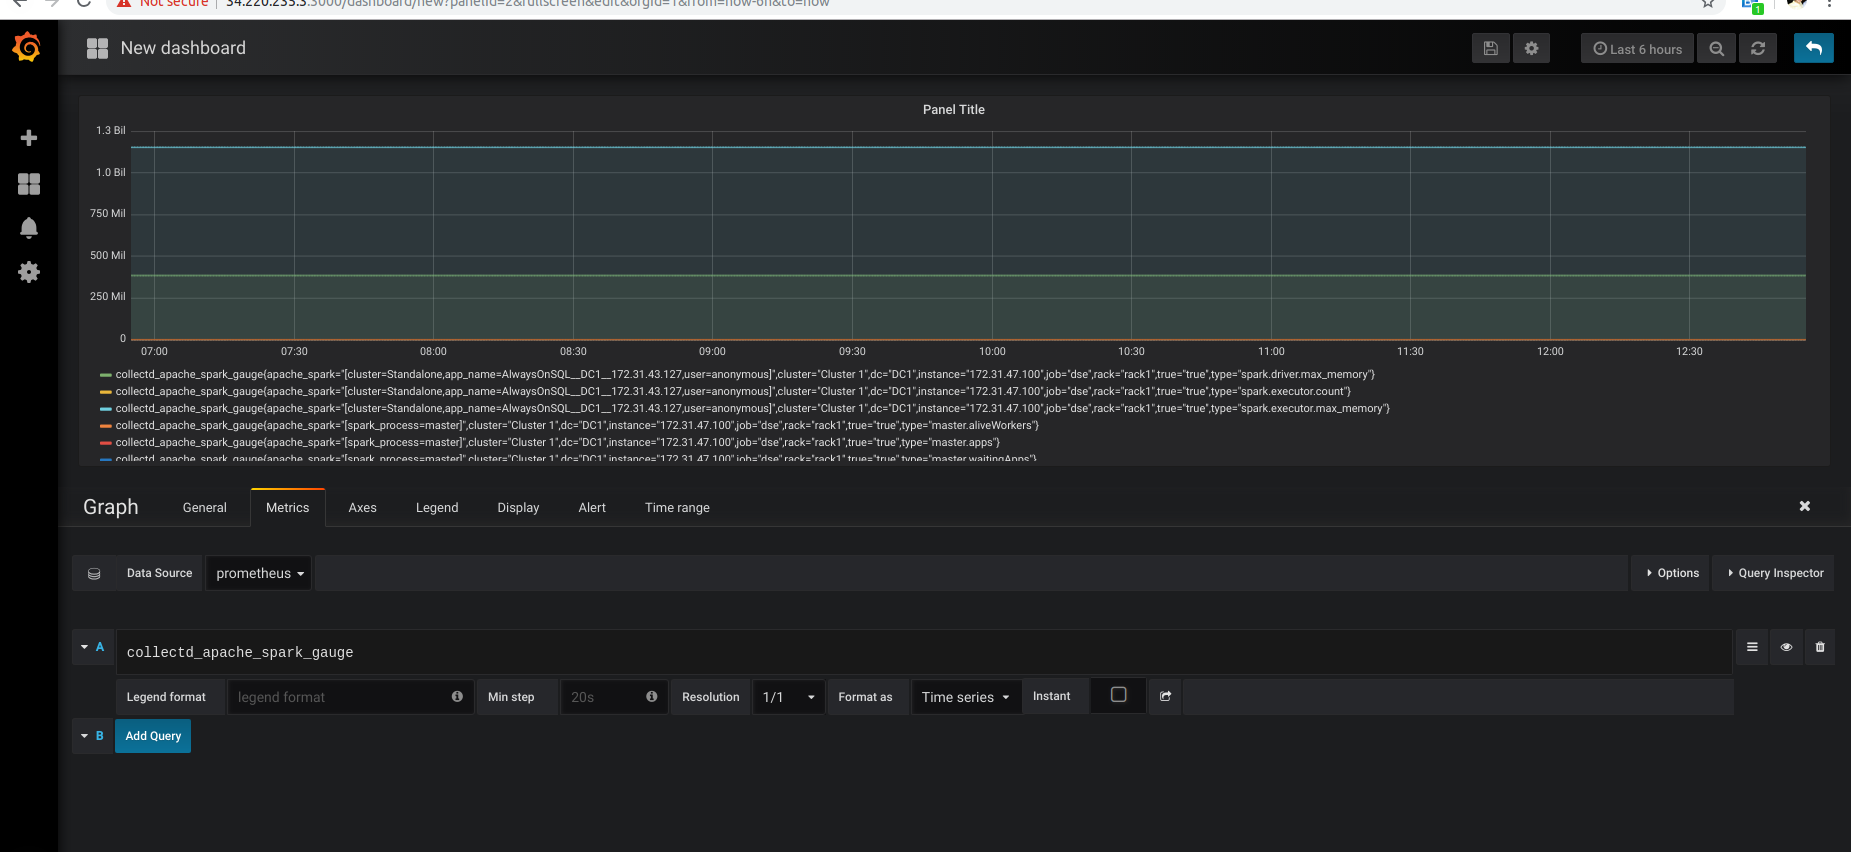
Here's a sample dashboard I hope to contribute to the DataStax Metrics Collector Github repo.
Hope you have found this article useful. Happy monitoring!
Resources
https://github.com/datastax/dse-metric-reporter-dashboards
https://github.com/signalfx/integrations/tree/master/collectd-spark#configuration
https://github.com/signalfx/collectd-spark/tree/v1.0.2/integration-test
https://academy.datastax.com/content/dse-metrics-collector-tutorial-using-dse-docker-images
* Collectd supports most monitoring systems via collectd write plugins.